Model
The math used in this model estimates the wine quality score as a function of the contents of alcohol, sulphates and citric.acid in the wine.
\[quality = \beta_{0} + \beta_{1}alcohol + \\ \beta_{2}sulphates + \beta_{3}citric.acid + \epsilon_{i}\]
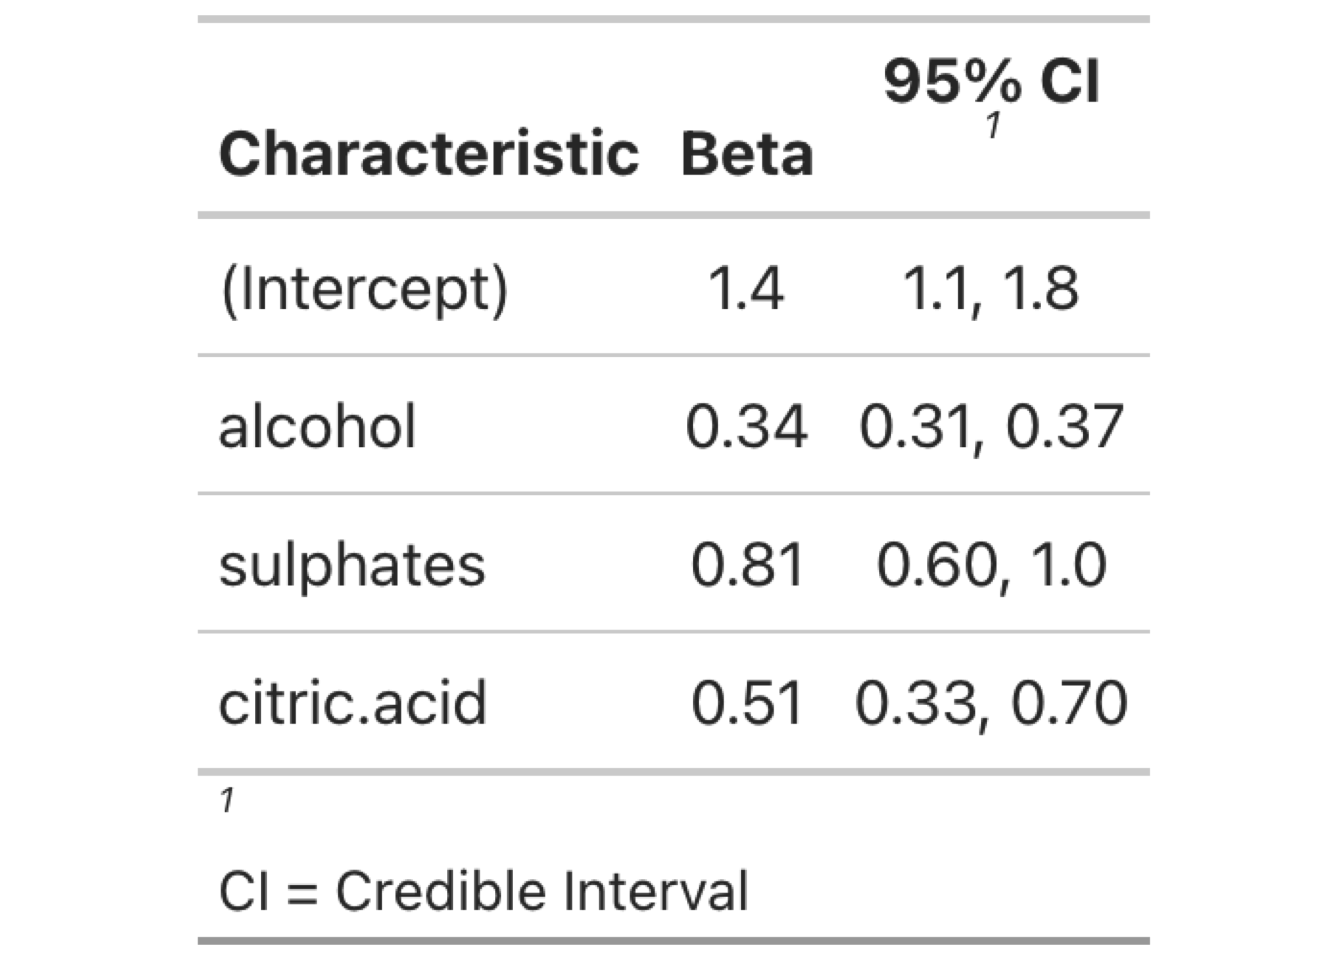
The table below shows that the probability of the wine quality score would be around 1.4 if alcohol, sulphates and citric.acid are not manipulated. However there is a positive effect on wine quality score when alcohol, sulphates and citric acid content increases.
Intercept: The intercept represents the expected value of the wine quality when all predictors (alcohol, sulphates, citric acid) are zero. However, in a practical context, the intercept mainly serves as a baseline reference point, as having zero values for these predictors is not realistic. Alcohol:
Effect of Alcohol: For each unit increase in the alcohol content, the wine quality score is expected to increase by 0.338 units, holding all other variables constant. The credible interval (0.307 to 0.371) does not include zero, indicating that the effect of alcohol content on wine quality is statistically significant and positive.
Effect of Sulphates:For each unit increase in sulphates, the wine quality score is expected to increase by 0.813 units, holding all other variables constant. The credible interval (0.605 to 1.024) does not include zero, indicating that the effect of sulphates on wine quality is statistically significant and positive.
Effect of Citric Acid: For each unit increase in citric acid, the wine quality score is expected to increase by 0.514 units, holding all other variables constant. The credible interval (0.334 to 0.697) does not include zero, indicating that the effect of citric acid on wine quality is statistically significant and positive.